학습곡선(learning curve)으로 편향과 분산 분석
주어진 훈련 데이터셋에 비해 모델이 너무 복잡하면(모델의 자유도나 모델 파라미터가 크면), 과대적합되고
새로운 데이터에 대한 일반화가 잘 안되는 경향이 있다.
보통 훈련 샘플을 추가하면 과대적합을 줄일 수 있지만, 실전에서는 불가능할 때가 많다.
훈련 정확도와 검증 정확도를 훈련 데이터셋의 크기 함수로 그래프를 그리면
모델에 높은 분산의 문제가 있는지 높은 편향의 문제가 있는지 알 수 있다.
높은 편향
편향이 높은 모델은 파라미터 개수를 늘임으로서 해결할 수 있다.(과소적합)
추가적인 특성을 추가하거나, 서포트 벡터 머신이나 로지스틱 회귀 분류기에서 규제 강도를 줄여야 한다.
높은 분산(훈련 정확도와 교차 검증 정확도 사이에 큰 차이)
더 많은 훈련 데이터를 모으거나 모델 복잡도를 낮추거나 규제를 증가시켜야 한다.
규제가 없는 모델에서는 특성 선택이나 특성 추출을 통해서 특성 개수를 줄여 과대적합을 줄일 수 있다.
훈련 데이터를 추가로 수집하면 과대적합을 가능성을 줄일 수 있지만,
잡음이 아주 많거나 모델이 거의 최적화된 경우 도움이 되지 않는다.
학습곡선(learning curve)
import matplotlib.pyplot as plt
import numpy as np
from sklearn.model_selection import learning_curve
pipe_lr=make_pipeline(StandardScaler(), LogisticRegression(penalty='l2', random_state=1, max_iter=10000))
train_sizes, train_scores, test_scores=\
learning_curve(estimator=pipe_lr, X=X_train, y=y_train, train_sizes=np.linspace(0.1, 1.0, 10), cv=10, n_jobs=1)
train_mean=np.mean(train_scores, axis=1)
train_std=np.std(train_scores, axis=1)
test_mean=np.mean(test_scores, axis=1)
test_std=np.std(test_scores, axis=1)
plt.plot(train_sizes, train_mean, color='blue', marker='o', markersize=5, label='Training accuracy')
plt.fill_between(train_sizes, train_mean+train_std, train_mean-train_std, alpha=0.15, color='blue',)
plt.plot(train_sizes, test_mean, color='green', linestyle='--', marker='s', markersize=5, label='Validation accuracy')
plt.fill_between(train_sizes, test_mean+test_std, test_mean-test_std, alpha=0.15, color='green')
plt.grid()
plt.xlabel('Number of training examples')
plt.ylabel('Accuracy')
plt.legend(loc='lower right')
plt.ylim([0.8, 1.03])
plt.tight_layout()
plt.show()

모델 훈련에 250개 이상의 샘플을 사용할 때 훈련과 검증 데이터셋에서 잘 작동한다.
훈련 데이터셋이 250개의 샘플보다 줄어들면 훈련 정확도가 증가하면서 훈련 정확도와 검증 정확도 사이의 차이가 넓어진다.(과대적합)
learning_curve 함수의 train_sizes 매개변수를 통해서 학습 곡선을 생성하는데 사용할 훈련 샘플의 개수나 비율을 지정
기본적으로 learning_curve 함수는 k-겹 교차 검증을 이용해서 분류기의 교차 검증 정확도를 계산한다.
cv=10으로 지정했기 때문에 10-겹 교차검증 시행(cv default value is 5)
회귀문제일 경우 KFold를 분류 문제일 경우 stratifiedKFold를 사용한다.
shuffle 매개변수를 True로 지정하면 훈련 데이터셋을 사용하기 전에 섞는다.(random_state와 동시 사용 불가)
return_times 매개변수를 True로 지정하면, 평가에 걸린 시간을 반환
fit 메서드에 필요한 매개변수와 값을 딕셔너리 형태로 지정할 수 있는 fit_parmas 매개변수가 사이킷런 0.24에 추가
max_iter 매개변수 default 값은 1000이다.
max_iter=10000로 함으로써 큰 규제 매개변수 값이나 작은 데이터셋 크기에서 발생할 수 있는 수렴 문제를 피할수 있다.
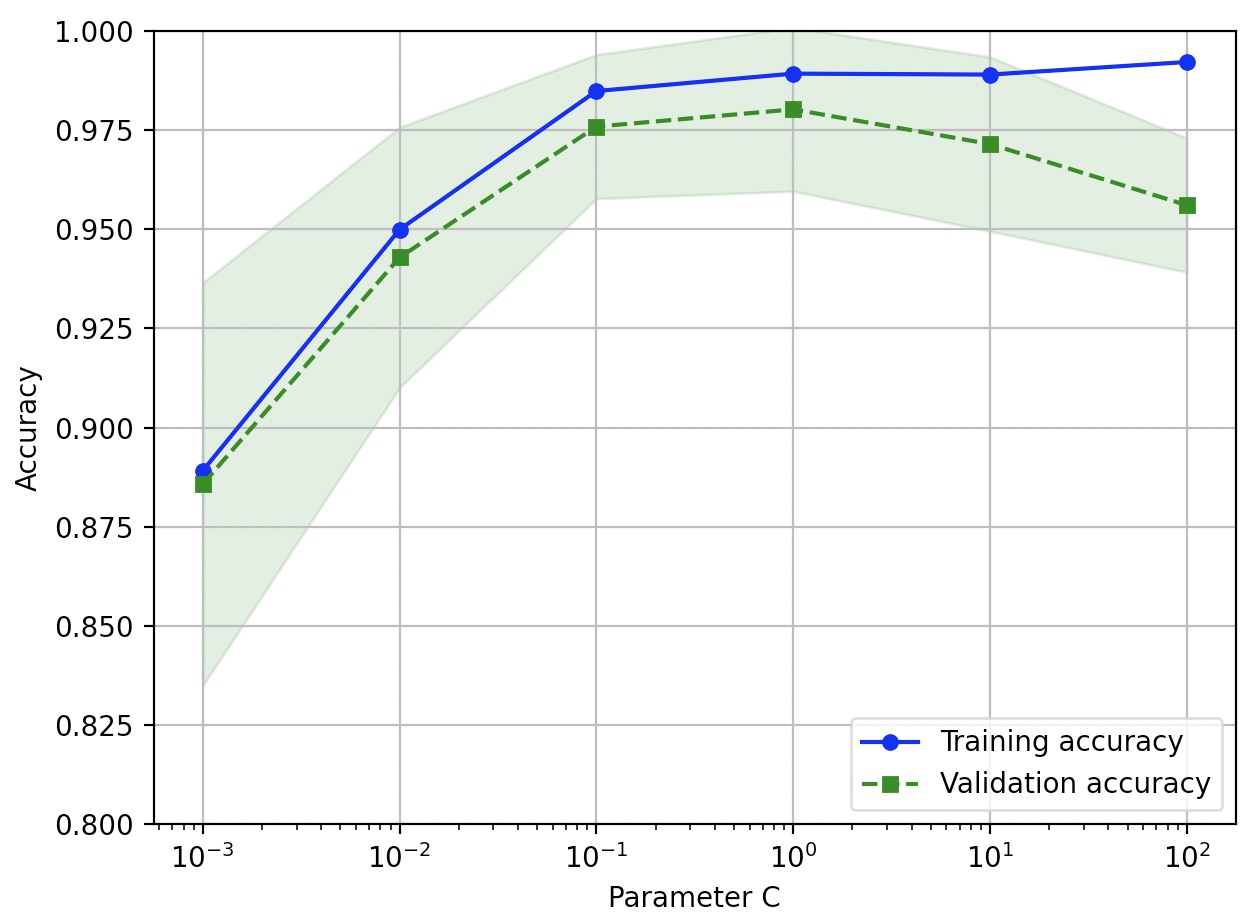
검증곡선(Validation curve)
검증 곡선은 학습 곡선과 관련 있지만,
샘플 크기의 함수로 훈련 정확도와 테스트 정확도를 그리는 대신 모델 파라미터 값을 함수로 그린다.
from sklearn.model_selection import validation_curve
param_range=[0.001, 0.01, 0.1, 1.0, 10.0, 100.0]
train_scores, test_scores=validation_curve(estimator=pipe_lr, X=X_train, y=y_train, param_name='logisticregression__C', param_range=param_range, cv=10)
train_mean=np.mean(train_scores, axis=1)
train_std=np.std(train_scores, axis=1)
test_mean=np.mean(test_scores, axis=1)
test_std=np.std(test_scores, axis=1)
plt.plot(param_range, train_mean, color='blue', marker='o', markersize=5, label='Training accuracy')
plt.fill_between(param_range, train_mean+train_std, tarina_mean-train_std, alpha=0.15, color='blue')
plt.plot(param_range, test_mean, color='green', linestyle='--', marker='s', markersize=5, label='Validation accuracy')
plt.fill_between(param_range, test_mean+test_std, test_mean-test_std, alpha=0.15, color='green')
plt.grid()
plt.xscale('log')
plt.legend(loc='lower right')
plt.xlabel('Parameter C')
plt.ylabel('Accuracy')
plt.ylim([0.8, 1.0])
plt.tight_layout()
plt.show()

LogisticRegression에서 max_iter=10000으로 지정하지 않았을 경우 C값에 따라서 오류가 발생 할 수 있다.
learning_curve 함수와 비슷하게 validation_curve 함수는 기본적으로 계층별 k-겹 교차검증을 사용하여 모델 성능을 추정
사이킷런의 파이프라인 안에 있는 LogisticRegression 객체의 매개변수를 지정하기 위해서는
‘logisticregression__C’처럼 쓴다.
(파이프라인에서 추정기나 변환기의 매개변수를 참조할 때는 객체와 매개변수를 밑줄 문자 두 개로 연결한다.)
C 값에 따라서 정확도 차이가 미묘하지만 규제 강도를 높이면(C 값을 줄이면) 모델이 데이터에 조금 과소적합되는 것을 볼 수 있다.
규제 강도가 낮아지는 큰 C 값에서는 모델이 데이터에 조금 과대적합되는 경향을 보인다.
위에서 적절한 C값은 0.01-0.1 사이이다.